
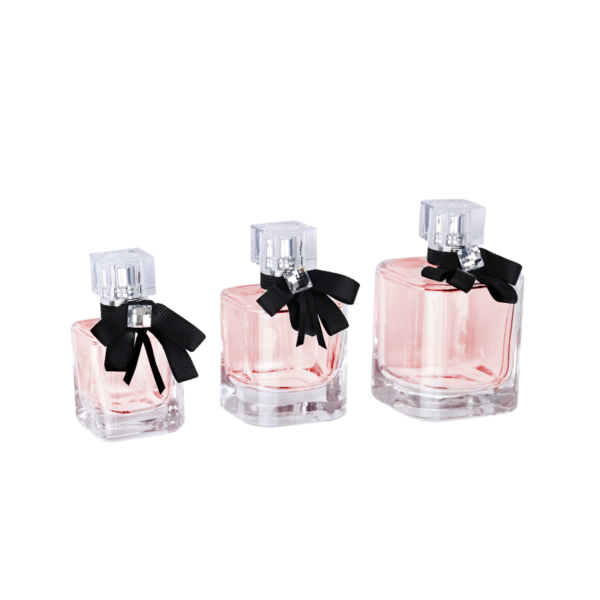
When Good-Looking Bottles Hide Bad Numbers
What are we missing?
You’re finalizing a seasonal launch, and the samples look great under studio light. The shortlist of china perfume bottle manufacturers checks out on price, MOQ, and colorways. You call a perfume bottles supplier you’ve used before and ask for “the safe option.” Data says otherwise: last quarter, 28% of projects had a two-week slip, 5% of flint glass bottles showed micro-bubble clusters near the shoulder, and 1 in 20 failed a 1.2m drop-test due to microcracks at the heel radius. So here’s the real question: if the shelf sample is beautiful, why do field results keep stinging your margin (and your timeline)? Look, it’s simpler than you think—and also not simple at all.
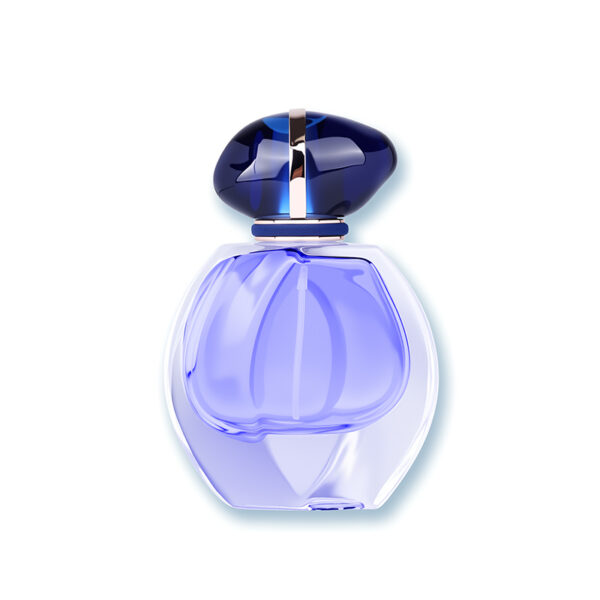
The hidden snag is how we judge risk. We rely on “golden samples,” not process stability. We skim an AQL chart, not the annealing lehr curve. We sign off atomizer feel, not crimp torque dispersion. Traditional checks miss what matters: mold tolerance drift during long runs, pump/valve misfit that causes weep under temperature cycling, UV coating pinholes that pass day-one but bloom after transit. And the pain point? Every fix arrives late, after inventory lands. That means rework, reprint, repack—funny how that works, right? The deeper layer is comparing capability, not catalogs. We need visibility into SPC, batch traceability, and the actual control plan. That’s the only way to spot the gap between pretty sample and repeatable run. Next up, let’s stack old habits against new signals and see what truly predicts a stable launch.
Comparative Insight: Old Checks vs. New Signals
What’s Next
Old method: judge by unit aesthetics, price, and a passable COA. New method: score the production system itself. The difference rests on technology principles. Best-in-class lines now use in-line vision to flag microfractures at the heel and finish, measuring mold flash in microns and logging data per cavity. SPC dashboards track wall thickness, crimp pressure, and atomizer output curve, not just “spray feels okay.” A digital traveler creates a lot-level passport with furnace temps, lehr dwell, and surface treatment sequence—then ties it to QR batch traceability. When you compare suppliers, you should be able to see those signals side-by-side. Some perfume bottle manufacturers china expose this data via API or a shared portal (even lightweight EDI works). Others can’t. That single difference predicts leakage rate, rework hours, and returns—faster than any glossy deck.
Let’s bring it back to those hidden gaps we flagged: AQL-only checks miss rare faults; “golden” samples mask run drift; and torque, not taste, drives leak-proofing. Moving forward means asking for telemetry, not just photos. Advisory close-out—three metrics to compare solutions: 1) Process capability index on key specs (finish ID, wall thickness, crimp seal force) with Ppk/Cpk ≥1.33 across at least three lots; 2) Traceability depth from raw flint glass batch to final atomizer assembly, including reject Pareto by cavity; 3) Preventive maintenance cadence on molds, pumps, and screen-print lines, with MTBF trends posted per cell. If you can’t get those, you’re still betting on luck—funny how that works, right? Share the load with partners who treat data like a product, not paperwork. For a grounded starting point and more open-book methods, see NAVI Packaging.